Südhof Lab Tools
All renewable reagents published in Südhof lab papers are freely available to non-profit research entities upon request, provided they are not restricted by MTAs that link the reagent to a third party. All reagents can be requested by e-mail from Tom Südhof (tcs1@stanford.edu) except for genetically engineered mice that are available from Jackson Labs.
A. Wet Lab Tools
A1. SynView
Using the crystal structures of neurexin/neuroligin complexes as a guide, we designed constructs based on the split-GFP concept that enable visualization of trans-synaptic neurexin/neuroligin complexes1.
References
1. Tsetsenis, T., Boucard, A., Arac, D., Brunger, A.T., and Südhof, T.C. (2014) Direct Visualization of Trans-Synaptic Neurexin-Neuroligin Interactions During Synapse Formation. J. Neurosci. 34, 15083-15096. PMCID: PMC4220035
A2. SynaptoTag
.png)
The SynaptoTag tool allows mapping presynaptic specializations formed by a neuron. Its premise is simple: Co-express a fluorescently tagged synaptic vesicle protein such as synaptobrevin (whose overexpression has no effect on synaptic transmission) with a general neuronal marker that labels axons and dendrites1. Depending on the experimental context, Cre (or its negative control DCre) can be included (panel A in right figure). The fluorescent synaptic vesicle protein (green in this example) will identify synaptic terminals that can then be quantified using the neuronal fluorescent protein (red) as a way to normalize the signal. In the experiment of the figure on the right2, SynaptoTag expressed in the medial entorhinal cortex (MEC) strongly labels synapses in the dentate gyrus, but also in the distal subiculum and the hippocampus proper.
References
1. Xu, W. and Südhof, T.C. (2013) A Neural Circuit for Memory Specificity and Generalization. Science 339, 1290-1195.
2. Zhang, X., Lin, P.Y., Liakath-Ali, K, and Südhof, T.C. (2022) Teneurins Assemble into Presynaptic Nanoclusters that Promote Synapse Formation via Postsynaptic Non-Teneurin Ligands. Nature Comm. 13, 2297. PMCID: PMC9050732
A3. SynTaMs
.png)
SynTAMs, for ‘Synaptic targeting molecules’, are expressed in neurons to label synapses or to manipulate synapse formation and/or synapse function1. In a sense, SynaptoTag is a SynTaM since it labels synapses. SynTaMs are based on the availability of reagents such as Homer1 or a nanobody to Homer1 that, when expressed in neurons, will be fully targeted to postsynaptic specializations1,2. At this point, we have developed SynTaMs for synapse labeling (panel A in adjacent figure) and for selectively suppressing postsynaptic cAMP levels (panel B). An expansion of this approach to developing tools that manipulate other signaling pathways is in progress and will be made available as soon as the tools are ready.
References
1. Sando, R., Ho, M.L., Liu, X., and Südhof, T.C. (2022) Engineered Synaptic Tools Reveal Localized cAMP Signaling in Synapse Assembly. J. Cell Biol. 221, e202109111. PMCID: PMC8685283
2. Dong, J.X., Lee, Y., Kirmiz, M., Palacio, S., Dumitras, C., MOreno, C.M., Sando, R., Santana, F., Südhof, T.C., Gong, B., Murray, K.D., and Trimmer, J. (2019) A toolbox of nanobodies developed and validated for use as intrabodies and nanoscale immunolabels in brain neurons. E-Life 8, pii: e48750. PMCID: PMC6785268
A4. Forced Synaptic Adhesion Tool
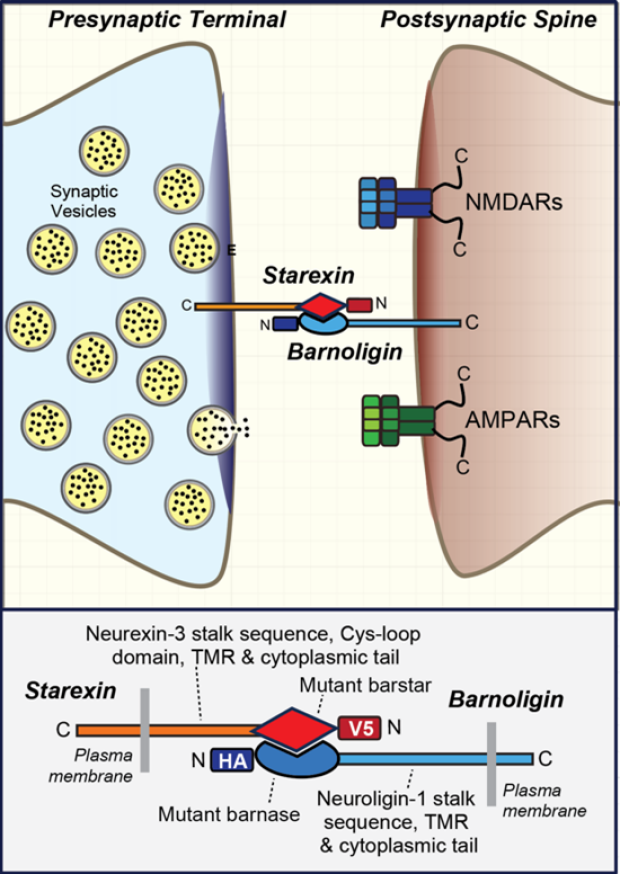
Our lab has begun to develop tools for forcing synapse formation between neurons and cells that would normally not be connected by synapses. For this purpose, we designed a pair of artificial adhesion molecules that combine bacterial interaction domains (barstar and barnase) with the transmembrane regions and cytoplasmic sequences of neurexins and neuroligins. These molecules, termed ‘starexin’ and ‘barnoligin’, force cells to adhere to each other (Figure on right). They were successfully tested in heterologous synapse formation1 but have not yet been validated in normal synapses in culture or in vivo. We plan to extend the design of this tool to other non-native interaction domains to create a library of specific interaction pairs enabling the directed formation of new neural circuits in brain.
References
1. Hale, W.D., Südhof, T.C., and Huganir, R.L. (2023) Engineered Adhesion Molecules Drive Synapse Organization. Proc. Natl. Acad. Sci. U.S.A. 120, e2215905120. PMCID: PMC9934208.
B. Computational Tools
B1. App for Ca2+-imaging signals in cultured neurons (author: Dr. Zijun Sun)
This App is run using MatLab for simple analyses of Ca2+-imaging signals, especially network activity, in cultured human or mouse neurons1.
References
1. Sun, Z., and Südhof, T.C. (2021) A simple Ca2+-imaging approach to neural network analysis in cultured neurons. J. Neurosci. Methods 349, 109041. PMCID: PMC7853247
B2. App for quantitation of in situ hybridization (author: Rebecca Refaee)
This App was developed because no suitable tool for quantifying non-canonical sections was readily available.
BREIN (Brain Region Expression Intensity Neuroanalysis) Application
What is BREIN?
BREIN (Brain Region Expression Intensity Neuroanalysis) App is a comprehensive tool that takes an initial brain image, anatomically registers it, calculates the signal intensity per brain region, and outputs a spreadsheet of the results, all through a single streamlined workflow. It analyzes RNA in-situ hybridization or immunohistochemical images, and can be used to map expression patterns and neuroanatomical circuits. This Java-based application can be run on any Windows device. BREIN has the advantage of being intuitive to use and completely self-contained—the user can upload an image and end up with final results in mere minutes, no post-processing necessary.
Features
- Image Uploading with Automatic Resolution Adjustment
BREIN is especially suited for high-definition, storage-intensive image files, automatically resizing them to the largest workable dimensions without any additional input from the user. The user can upload an arbitrarily large JPG image and the app will still be able to handle it, reading it in with buffers while simultaneously tailoring the pixel dimensions to the maximum size that allows efficient computation. This is an improvement over many existing programs which require the user to find their own software to modify the image resolution prior to uploading, usually greatly decreasing the quality of the image and therefore the accuracy of the results. BREIN simplifies the researcher’s task by performing all resolution edits internally and autonomously.
- Two-Step Image Registration
The user can then select an anatomical reference section that best matches their image. BREIN’s resources include all of the murine anatomical references provided by the Allen Atlas (P56 coronal, and P56, P14, P4, E15.5, E13.5, and E11.5 sagittal sections). Once the proper section has been identified, the user can adjust the reference to ensure it exactly matches the anatomical layout of their image. A variety of image transformations, both affine and nonlinear, are available: the user is free to resize, translate, rotate, and distort until the image and its reference coincide anatomically. These whole-image transformations are the first step in registration, all performed via an intuitive click-and-drag user interface to allow for ease of use. The next step is a fine-tuning process that corrects for any lingering deviations the image may have from the expected anatomy. The user is able to manually redraw any part of the reference that still differs from the image after the first round of transformations. This process ensures a high degree of accuracy since the reference can be adjusted until it reflects the image’s neuroanatomy as closely as possible. Alternatively, if the user is only interested in particular regions, multiple ROI's can be drawn, customizing the registration process.
- Adaptable Quantification Algorithm
Once the image has been registered, BREIN uses a threshold algorithm to quantify expression in each brain region. The RGB value of each pixel is considered, and if it meets the threshold for being classified as a certain color, it counts towards the final expression metric; otherwise, it is excluded. Then, the total pixel count for each color is divided by the area of the region, so the final expression values are normalized to area. The intensity values can also be normalized to a particular color’s intensity; for example, they can be normalized to DAPI to account for variations in cell density. The user can change the threshold parameter, allowing the analysis to be customized to that particular image. For example, if expression is low and difficult to detect, the threshold can be lowered to allow faint signals to still be analyzed. Similarly, if there is high background signal, the threshold can be raised to exclude it. There is also a sensitivity parameter that adjusts the degree to which the app discriminates between similar colors: low sensitivity means shades similar to the target hue are counted as expression, while high sensitivity means that only pixels that closely match the desired RGB values will contribute to the total metric. These two adjustable parameters—threshold and sensitivity—allow BREIN to be effective in analyzing a wide range of image types with unique characteristics.
Results
The final intensity values are outputted in an Excel spreadsheet, with each row labeled with a region and each column labeled with a color. The data provide a quantitative measure of relative signal intensity, helping to solve remaining questions in neuroscience that require a more detailed understanding of neuronal expression patterns.