Knee Cartilage MRI T1rho (CubeQuant), T2 (qDESS) and Sodium (Cones) Variability

The average CVRMS (±standard deviation) for each parameter and technique in two categories: intra-subject variability due to short, moderate, and long-term time periods and the post-processing segmentation variability due to intra-observer, adjacent-slice, and inter-observer variability for (A) T1ρ, (B) T2, and (C) sodium measurements. All CVRMS measurements are substantially lower than the changes expected due to advanced osteoarthritis
T1rho and T2 relaxation times as well as sodium MRI are parameters that are correlated with cartilage proteoglycan and collagen macromolecules. With the onset of Osteoarthritis (OA), reports have shown a loss of proteoglycans and changes in the collagen structure that results in increased T1rho and T2 relaxation times and a decrease in the sodium signal intensity. It is important to quantify the variability of these quantitative MRI parameters, as changes due to OA can be small (on the order of 5-10%). In this work, we investigate three novel sequences – CubeQuant T1rho, quantitative DESS T2 and cones Sodium and comprehensively validate the variability using year-long intra-subject variability studies as well as variability of segmentation and post-processing.
Jordan CD, McWalter EJ, Monu UD, Watkins RD, Chen W, Bangerter NK, Hargreaves BA, Gold GE. Variability of CubeQuant T1rho, quantitative DESS T2, and cones sodium MRI in knee cartilage. Osteoarthritis Cartilage. 2014 Oct;22(10):1559-67.
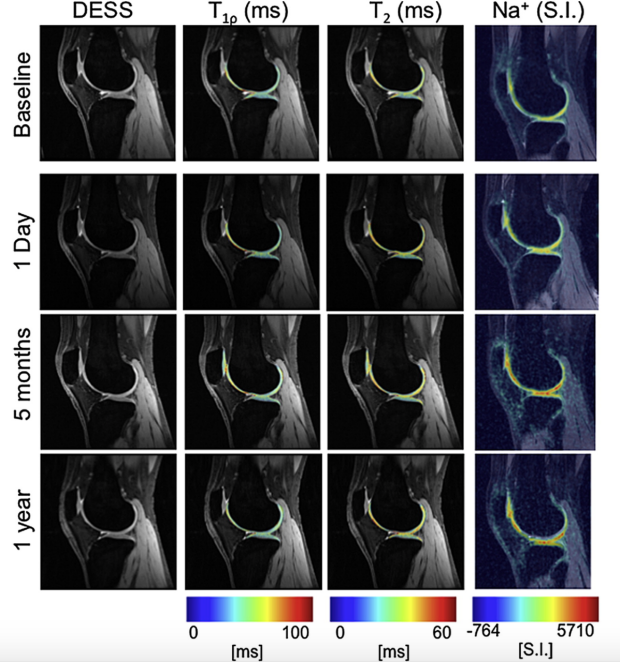
DESS images and MR parameter maps of T1ρ, T2, and sodium
Caroline Jordan, Emily McWalter, Uche Monu, and Neal Bangerter are alumni of the BMR group